Monday, 9 October 2017

Pre Lab 1

Assalamualaikum WBT and good day to everyone. 

Today 9th October, we have done one of the task that have been given by Sir Shah. We need to use LabView to generate the signals by using DAQ  and trainer.

 First of all, the steps to set up the signals 
  1. Click blank VI 
  2. Right click, click on Express. 
  3. Click on Input, then click DAQ. 
  4. Connect DAQ with the trainer. 
  5. Configure the DAQ. 

(i) Triangle 3Vpp


(ii) Rectangle 5Vamp


(iii) Sinusoidal 2.55 Vrms


Monday, 11 September 2017

Chapter 3: Modifying the Appearance of Graphs


You can use the Display Format page of the Graph Properties dialog box
to specify how the scales of the x-axis and y-axis appear on the graph.
Complete the following steps to change the format of the x-axis and y-axis
of the Unfiltered Signal and Filtered Signal graphs.
1. In the front panel window, right-click the Unfiltered Signal graph
indicator and select Properties from the shortcut menu. The Graph
Properties dialog box appears.
2. On the Display Format page, select Time (X-Axis) from the top
pull-down menu.
3. Select the Default editing mode option.
4. In the Type list, select Automatic formatting.
5. In the Digits field, enter 6 and select Significant digits from the
Precision Type pull-down menu.
6. Place a checkmark in the Hide trailing zeros checkbox.
7. Select Amplitude (Y-Axis) from the top pull-down menu and repeat
steps 3–6 so the y-axis configuration matches the x-axis configuration.
8. On the Scales page, select Amplitude (Y-Axis).
9. Remove the checkmark from the Autoscale checkbox.

Chapter 3: Filtering a Signal


Complete the following steps to configure the Filter Express VI to filter the
signal using an infinite impulse response (IIR) filter.
1. Display the block diagram window and remove the wire that connects
the Result output of the Formula Express VI to the Signals input of the
Amplitude and Level Measurements Express VI.
2. Remove all broken wires that result from removing the wire.
3. Search for the Filter Express VI, shown at left, and add it to the block
diagram between the Simulate Signal2 Express VI and the Amplitude
and Level Measurements Express VI. The Configure Filter dialog
box appears.
4. In the Filter Specifications section, change the Cutoff Frequency
(Hz) to 25.
5. Click the OK button to save the configuration and close the Configure
Filter dialog box.
6. Display the front panel.
7. Click the Unfiltered Signal waveform graph indicator and press the
<Ctrl> key while you drag with the Positioning tool to create an
additional waveform graph indicator.
8. Triple-click the Unfiltered Signal 2 label above the new waveform
graph indicator and enter Filtered Signal to change the label of
the indicator. You also can change the label on the Appearance page
of the Graph Properties dialog box.
9. On the block diagram, wire the Result output of the Formula Express
VI to the Signal input of the Filter Express VI and to the Unfiltered
Signal waveform graph indicator.
10. Wire the Filtered Signal output of the Filter Express VI to the Signals
input of the Amplitude and Level Measurements Express VI and to the
input of the Filtered Signal waveform graph indicator.
11. Select File»Save.

Chapter 3: Adding a Signal


The Simulate Signal Express VI simulates a sine wave by default. You can
customize the simulated signal by changing the options in the Configure
Simulate Signal dialog box.
Complete the following steps to create an additional simulated signal that
adds uniform white noise to the sine wave.

1. On the block diagram, use the Positioning tool to select the Simulate
Signal Express VI.

Hold down the <Ctrl> key and click and drag to create an additional
Simulate Signal Express VI on the block diagram. (Mac OS X) Hold
down the <Option> key and drag. (Linux) You also can hold down the
middle mouse button and drag.

2. Release the mouse button to place the copied Simulate Signal Express
VI below the original Simulate Signal Express VI. LabVIEW updates
the name of the copied Simulate Signal Express VI to Simulate
Signal2.

3. Double-click the Simulate Signal2 Express VI to display the
Configure Simulate Signal dialog box.

4. Select Sine from the Signal type pull-down menu.

5. Enter 60 in the Frequency (Hz) text box.

6. Enter 0.1 in the Amplitude text box.

7. Place a checkmark in the Add noise checkbox to add noise to the sine
signal.

8. Select Uniform White Noise from the Noise type pull-down menu.

9. Enter 0.1 in the Noise amplitude text box.

10. Enter -1 in the Seed number text box.

11. In the Timing section, select the Run as fast as possible option.

12. In the Signal Name section, remove the checkmark from the Use
signal type name checkbox.

13. Enter 60 Hz and Noise in the Signal name text box.

Chapter 3: Modifying a VI Created from a Template

Complete the following steps to create a VI that generates, analyzes, and
displays a signal.

1. In the Getting Started window, click New to display the New dialog
box.

2. From the Create New list, select VI»From Template»Tutorial
(Getting Started)»Generate, Analyze, and Display. This template
VI simulates a signal and analyzes it for its root mean square (RMS)
value.

3. Click the OK button or double-click the name of the template to create
a VI from the template.

4. If the Context Help window is not visible, press the <Ctrl-H> keys to
display the window. (Mac OS X) Press the <Command-Shift-H> keys.

5. Display the block diagram by pressing the <Ctrl-E> keys.

6. Move the cursor over the Amplitude and Level Measurements Express
VI, shown at left.

The Context Help window displays information about the behavior of
the Express VI.
Keep the Context Help window open. It will provide useful
information as you complete the rest of this exercise.

7. Display the front panel and remove the RMS indicator, shown at left.
You will not use the RMS functionality of the Amplitude and Level
Measurements Express VI for this exercise. However, you can use the
Generate, Analyze, and Display template VI with the RMS
functionality in the future to reduce development time.

8. Display the block diagram and remove any broken wires that result
from removing the RMS indicator. To remove all broken wires from
the block diagram, you can press the <Ctrl-B> keys.

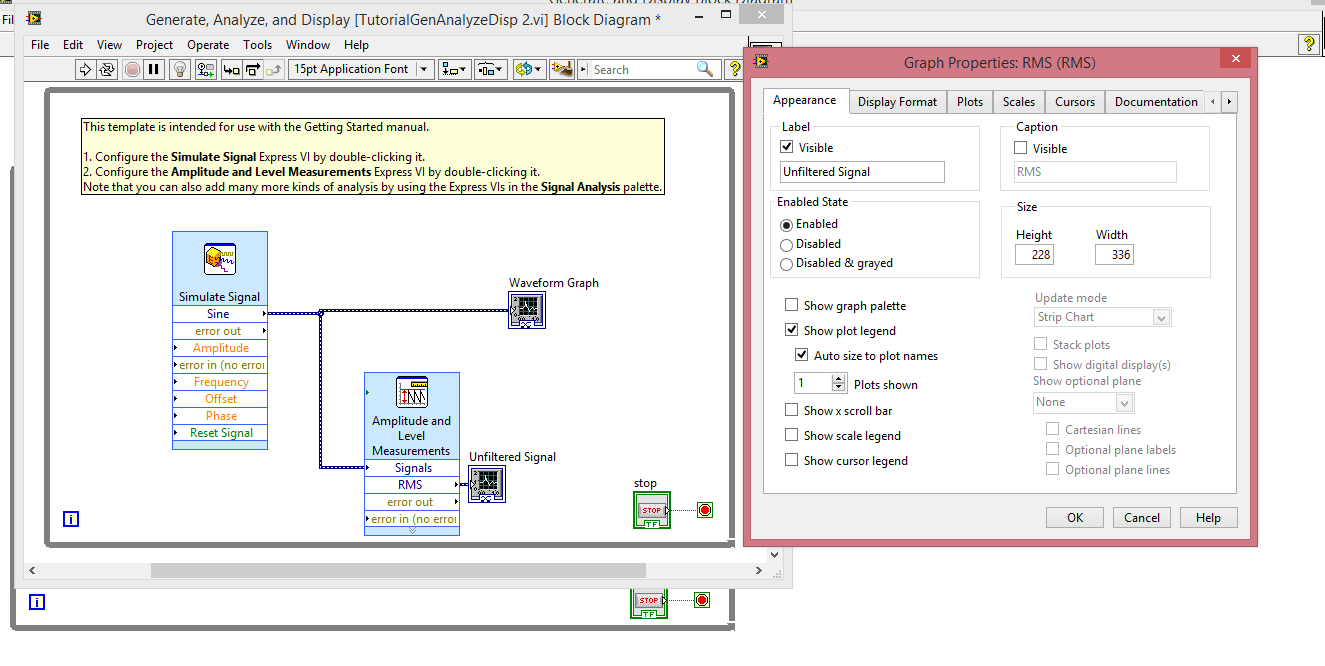
9. Then return to the front panel window and right-click the waveform
graph indicator. Select Properties from the shortcut menu. The Graph
Properties dialog box appears.

10. On the Appearance page, place a checkmark in the Visible checkbox
in the Label section and enter Unfiltered Signal in the text box.

11. Click the OK button to save the configuration and close the Graph
Properties dialog box.

12. Run the VI.

The signal appears in the graph.

13. Click the STOP button to stop the VI.

Chapter 2: Using a Table to Display Data


Complete the following steps to display a collection of mean values in a
front panel table.

1. Display the front panel.

2. On the Controls palette search for the Express Table indicator and
add it to the right of the waveform graph.

3. Display the block diagram.

LabVIEW wired the Table terminal to the Build Table Express VI.

4. If the Build Table Express VI and the Table terminal are not selected
already, click an open area on the block diagram to the left of the Build
Table Express VI and the Table terminal. Drag the cursor diagonally
until the selection rectangle encloses the Build Table Express VI and
the Table terminal, shown at left.

5. Drag the objects into the While Loop to the right of the Sample
Compression Express VI.
If you drag objects near the border of the While Loop, the loop resizes
to enclose the Build Table Express VI and the Table terminal after you
add the object to the block diagram.

6. Use the Wiring tool to wire the Mean output of the Sample
Compression Express VI to the Signals input of the Build Table
Express VI.

7. The block diagram should appear similar to Figure 2-5.
Figure 2-5. Block Diagram of the Reduce Samples VI
8. Display the front panel and arrange the controls and indicators as
shown in Figure 2-1.

9. Run the VI.

10. Click the Enable switch.

If the Enable switch is on, the table displays the mean values of every
25 samples of the sine wave. If the Enable switch is off, the table does
not record the mean values.

11. Stop the VI.

12. Experiment with properties of the table by using the Table Properties
dialog box. For example, try changing the number of columns to one.

13. Save and close the VI.

Chapter 2: Controlling the Speed of Execution


To plot the points on the waveform graph more slowly, you can add a time
delay to the block diagram.
Complete the following steps to control the speed at which the VI runs.
1. On the block diagram, search for the Time Delay Express VI, shown at
left, on the Functions palette and place it inside the While Loop.
You can use the Time Delay Express VI to control the execution rate
of the VI.

2. Enter 0.25 in the Time delay (seconds) text box.
This time delay specifies how fast the loop runs. With a 0.25 second
time delay, the loop iterates once every quarter of a second.

3. Click the OK button to save the current configuration and close the
Configure Time Delay dialog box.

4. Display the front panel and run the VI.

5. Click the Enable switch and examine the change on the graph.
If the Enable switch is on, the graph displays the reduced signal. If the
Enable switch is off, the graph does not display the reduced signal.

6. Click the STOP button to stop the VI

Chapter 2: Using the Error List Window

a VI contains an indicator you do not want to use, you can delete it.
Complete the following steps to remove the Mean indicator from the front
panel.

1. Display the front panel and move the cursor over the Mean indicator
until the Positioning tool appears.

2. Click the Mean indicator, shown at left, to select it and press the
<Delete> key.

3. Display the block diagram.

4. Click the broken Run button to display the Error list window.
The Error list window lists all errors in the VI and provides details
about each error. You can use the Error list window to locate errors.

5. In the errors and warnings list, select the Wire: has loose ends
error and click the Help button to display more information about the
error.

6. In the errors and warnings list, double-click the Wire: has loose
ends error to highlight the broken wire.

7. Press the <Ctrl-B> keys to delete the broken wire.

8. Select View»Error List to display the Error list window. No errors
appear in the errors and warnings field.

9. Click the Close button to close the Error list window.
The Run button no longer appears broken.

Chapter 2: Customizing a User Interface from the Block Diagram


Complete the following steps to create controls and indicators from the
block diagram.

1. On the block diagram, right-click the Mean output of the Sample
Compression Express VI and select Create»Numeric Indicator from
the shortcut menu to create a numeric indicator. A Mean indicator,
shown at left, appears on the block diagram.

2. Right-click the Mean output of the Sample Compression Express VI
and select Insert Input/Output from the shortcut menu to insert the
Enable input.

3. Right-click the Enable input and select Create»Control from the
shortcut menu to create a switch. A Boolean control, shown at left,
appears on the block diagram.

4. Right-click the wire that connects the Sine output of the Simulate
Signal Express VI to the Signals input of the Sample Compression
Express VI and select Create»Graph Indicator from the shortcut
menu.

5. Use the Wiring tool to wire the Mean output of the Sample
Compression Express VI to the Sine graph indicator.
The Merge Signals function appears.

Chapter 2: Searching the Help and Modifying a Signal

Welcome back !


Assalamualaikum wbt.

Next, we will proceed to search the Help and Modifying a Signal. Click the Search Tab, enter SAMPLE COMPRESSION. After read the description of the Express VI, click the Add to the block diagram button.

Add the Sample Compression Express VI to the right of the Simulate Signal Express VI. Configure the SAMPLE COMPRESSION to reduce the signal by a factor of 35 using the mean of these values. Then, click OK. Use the wiring tool to wire the Sine output of the Simulate Signal Express VI to the Signals input of the Sample Compression Express VI.


Monday, 4 September 2017

Chapter 1 : Modifying a Signal and Displaying Two Signals on the Graph


To modify a signal, we need to delete the wire that connects the Simulate Signal Express VI  to the Waveform Graph Terminal. Select View >> Function Palette  to display it. On the Arithmetic & Comparison palette, select the Formula Express Palette and place it between the Simulate Signal Express VI and the Waveform Graph Terminal.


Change the text in the Label column of the dialog box option, from X1 to Sawtooth to indicate the input value to the Formula Express VI. Then, we can define the value of the scaling factor by entering *10 after Sawtooth in the Formula text box.  If we use the keyboard, click in the Formula text box after Sawtooth and enter the formula you want to appear in the text box.
The Configure Formula dialog box should appear similar too. 


Sunday, 3 September 2017

Chapter 1 : Wiring Objects on the Block Diagram

Figure 1 : Connect the two wires
Figure 2 : Change the type of Simulate Signal

Figure 3 : A knob 


On the block diagram, try to move the cursor over the Knob terminal, shown
at left. The cursor becomes an arrow. Then, we can resize, position and select the objects. 


Move the cursor over the arrow on the Knob terminal, shown at left. The cursor becomes a wire spool, or the Wiring tool, shown at left. Use the Wiring tool to wire objects together on the block diagram. When the Wiring tool appears, click the arrow on the Knob terminal and then click the arrow on the Amplitude input of the Simulate Signal Express VI, shown at left, to wire the two objects together.

A wire appears and connects the two objects. Data flows along this
wire from the Knob terminal to the Express VI.  Lastly, save the file by using Ctrl + S. 

Chapter 1 : Changing Signal type

Figure 1 : Configure Simulate Signal

Figure 2 : Change the type of signal

Figure 3 : Generate and Display the signal

To change the signal type, Right-click the Simulate Signal Express VI and select Properties from
the shortcut menu to display the Configure Simulate Signal dialog box.  Then, Select Sawtooth from the Signal type pull-down menu.The waveform on the graph in the Result Preview section changes to
a sawtooth wave. 


Saturday, 2 September 2017

Chapter 1 : Adding a Control to the Front Panel

Figure 1 : Control Palette


How to add the control in front panel?

Right click any blank space of the block diagram to display Controls or Function Palette or else Controls Palette opens with the Express Palette. Next, move the cursor to the Numeric Controls and click it. Then, click the Knob Control on the Numeric Controls Palette. Then, add the Knob to the front panel of the waveform graph. Select File»Save As and save the VI as Acquiring a Signal.vi.

Wednesday, 30 August 2017

Chapter 1 : Getting started with LabView

Figure 1: The tutorial to generate and display the sine wave

Assalamualaikum wbt and a very good day to all of readers.

I will start my first post with the first chapter. My first chapter is to review and getting started with labview.

First and foremost, launch LabView. In the Getting Started window, click the New or VI from Template. From the Create New list, select VI>>From Template>>Tutorial (Getting Started)>>Generate and Display. This template VI generates and displays a signal.


Figure 2 : The figure shows the VIs and structure


Then, click the Windows >> select Block Diagram. Block diagram have been displayed through the screen of laptop. The figure shows the VIs and structures that control the front panel objects. Next, click the RUN button shown at left. A sine wave appeared on the graph in the front panel window. 


Figure 3 : Sine wave


Stop the VI by clicking the STOP button, shown at left.